

“Many changes due to past and future greenhouse gas emissions are irreversible for centuries to millennia, especially changes in the ocean, ice sheets and global sea level.”
IPCC WG1 AR6 Headline Statement from the Summary for Policymakers
Most of us know by now that one of the major consequences of global warming is sea level rise. Global mean sea level has risen around 20 cm over the past century, and at ever increasing rates. From 1971 to 2018, thermal expansion of ocean water explained 50% of the sea level rise, while ice loss from glaciers contributed to 22%, ice sheets 20% and the remaining 8% were due to changes in land water storage. However, in recent years, ice-sheet mass loss has increased by a factor of four, and together with glacier mass loss, it has become the dominant contributor to global mean sea-level rise (IPCC AR6 WG1 SPM). As ice-sheet mass loss continues to increase in the coming decades and centuries, its contribution will eventually dominate sea level rise (Oppenheimer et al. 2019). Until recently, the climate models we use to project twenty-first century climate change have not included ice sheets in their simulations. This is starting to change in the Earth System Models (ESMs) that are being developed in ESM2025.
ICE SHEETS AND CLIMATE FEEDBACKS
The Greenland and Antarctic ice sheets are huge masses of glacial ice, mostly sitting on land. Where they extend to the coast and over the ocean, they are called ice shelves. Ice sheets form when annual snow accumulation is greater than melt. The snow that falls accumulates and compacts into solid ice as it is buried and weighed down by ever more snow falling on top. Where you have an ice sheet, ice mass loss can happen through multiple processes: (i) melting at the surface or the base of the ice sheet leading to water runoff, (ii) ice shelves melting directly into the ocean when in contact with seawater and (iii) iceberg calving, a process through which intact chunks of ice break abruptly from the ice sheets and become drifting icebergs. When climate conditions remain stable, the ice mass gain through snowfall balances the mass loss due to melting and iceberg calving; in a warming environment though, increased melting and calving can lead to ice mass loss.
Land ice stores about 75% of the world’s freshwater, with Greenland and Antarctic Ice Sheets representing approximately 7 m and 58 m of sea level rise, respectively.
The uncertainty of the ice sheet contribution
Not only will ice sheet melt eventually be the main contributor to global sea-level rise, it is also currently the most uncertain part of that budget. Due to poor understanding of ice-sheet instability processes, and to ice-sheet modelling limitations, a large range of plausible future sea-level rise scenarios has to be considered.
There is limited evidence for low-likelihood, high-impact outcomes – in some cases involving tipping points – that would significantly increase ice mass loss from the Antarctic Ice Sheet for centuries, and thus strongly influence future sea level rise. However, at the current state-of-the-art, a sea-level rise (relative to 1995–2014) greater than 2 m, by 2100, cannot be ruled out, and further research is needed to reduce the uncertainty.
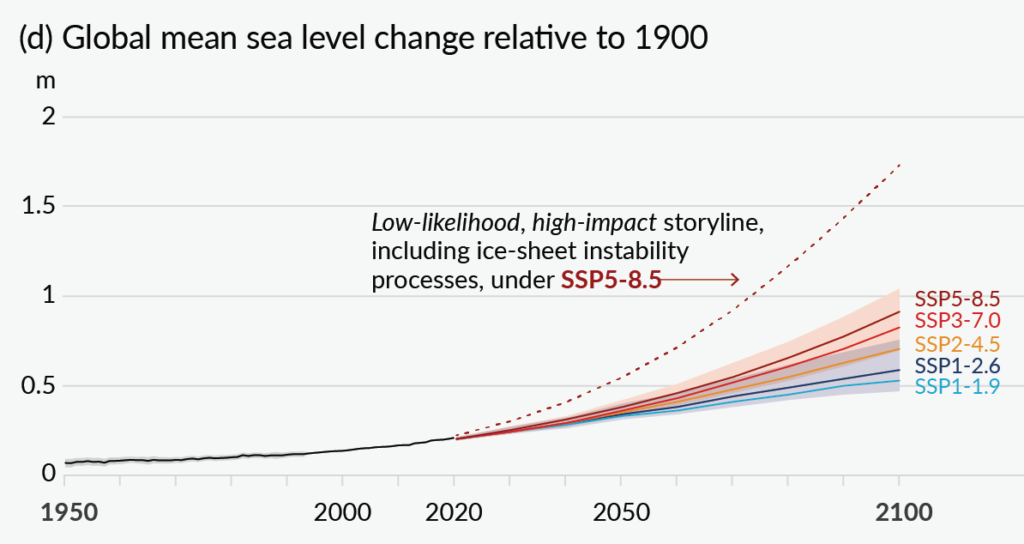
Global mean sea level change in metres, relative to 1900. Only likely (more than 66% probability) ranges are assessed for the different scenarios due to difficulties in estimating the distribution of deeply uncertain processes. The dashed curve indicates the potential impact of these deeply uncertain proces ses. It shows the 83rd percentile of SSP5-8.5 projections that include low-likelihood, high-impact ice-sheet processes that cannot be ruled out. Shared socioeconomic pathways considered go from very low greenhouse gas emissions (SSP1-1.9) to very high greenhouse gas emissions (SSP5-8.5) (Figure SPM.8 d) of the IPCC AR6 Summary for Policy Makers).
Interactions between ice sheets and the climate system
Ice sheets do not just passively respond to the climate they are in, but play a part in determining that climate when they change through a number of feedbacks. These feedbacks can be global or local, and increase or attenuate the ice sheet response to a warming climate. As an example of a local feedback, more surface melting in Greenland will decrease the albedo and lower the surface elevation, both of which will reinforce the melting. On the contrary, more ice shelf melting by the ocean can make the ice shallower and therefore in contact with colder water, which reduces the melting. Other feedbacks involve the global climate, through the ocean and atmosphere circulation. For example, increasing meltwater from Greenland could slow down the Atlantic overturning circulation, while increasing meltwater from Antarctica effectively warms the Southern Ocean subsurface, leading to even more melting and changes in global ocean deep water properties.
All these physical interactions between ice sheets, the atmosphere and the ocean around them play an important role in determining the state of the climate system. Hence, in order to fully understand how ice sheets will respond to climate change, and to better constrain future projections of sea level rise, it is essential to develop tools that are “capable of modelling the co-evolution of ice sheets and climate, a difficult task made yet more challenging by the wide range of spatial- and time-scales that need to be considered to model these systems simultaneously”.
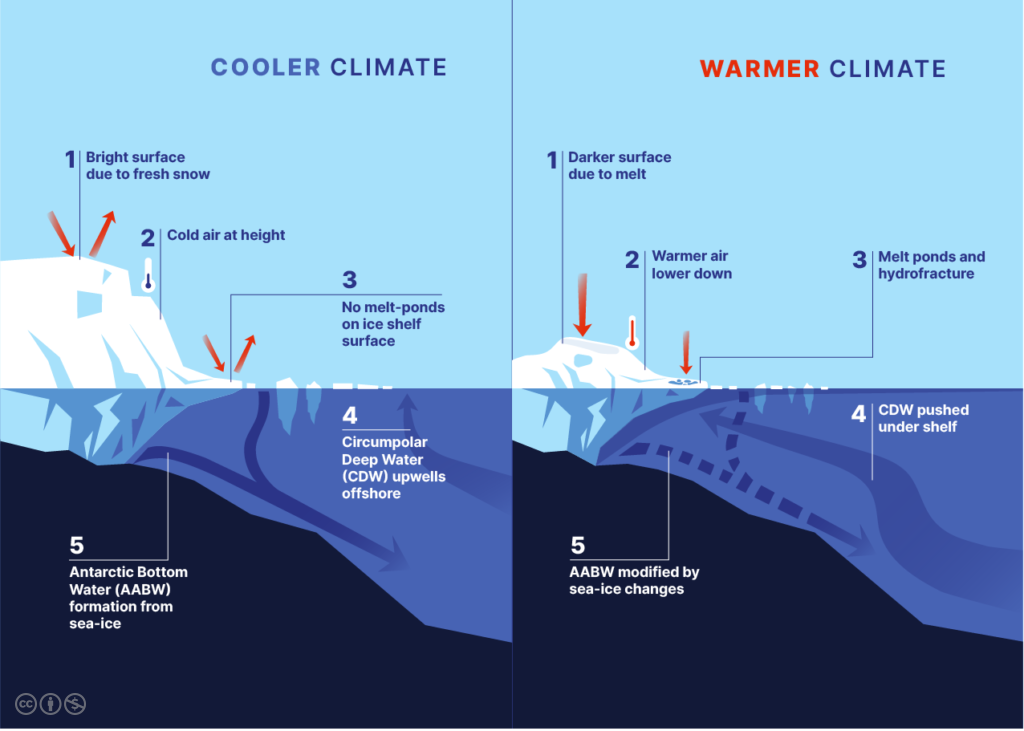
Interactions and feedbacks between ice sheets, the atmosphere and the ocean, in cooler and warmer climates.
1. Fresh snow is bright white and reflects nearly all of the sunlight that shines on it; in a warmer climate, snow that has started to melt, bare ice or surfaces that have melt water pooling on them are much darker and absorb more solar energy, creating a melt feedback. 2. Air temperature falls with altitude: a higher altitude means a colder ice sheet; in a warmer climate, as the ice sheet melts, its surface gets lower, bringing the surface into contact with ever warmer air, creating a melt feedback. 3. In a cooler climate, there are no melt-ponds on ice shelf surface and the relatively small amount of surface melt refreezes in the snowpack; in a warmer climate, extensive networks of melt ponds can form on the surface. The water flows into cracks in the ice surface where the pressure forces the cracks wider and weakens the ice shelf. 4. The current wind forcing and ocean stratification mean that the relatively warm Circumpolar Deep Water (CDW) upwells offshore; in a warmer climate, ice shelf melt and changes in sea-ice and winds alter the stratification, and the warm CDW stays under the surface. 5. Sea-ice formation involves rejecting the sea salt that does not fit into ice crystals. In a cooler climate, the resulting very salty water interacts with cold ice shelf melt to form Antarctic Bottom Water (AABW), part of the global ocean circulation; in a warmer climate, complex interactions between reductions in sea-ice and the increased ice shelf melt modify AABW formation with consequences for the global ocean and climate.
ICE SHEET MODELLING
Most current projections of the contribution of ice sheet mass loss to sea level rise are carried out by ice sheet models (ISM) that are not coupled to the rest of the climate system. The climate models that are used to generate the climate projections provide the input for these ISMs, but there are no two-way interactions. Therefore, no feedbacks between ice sheets and the climate system are considered.
Furthermore, some processes that are fundamental to understanding the contribution of ice sheet melt to sea level rise can hardly be modelled by uncoupled climate or ice sheet models. The modelling of ice shelf cavities is a striking example: most frequently in climate models, the frontier between the Antarctic continent and the Southern Ocean is represented as one big cliff. Without correctly modelling the ocean circulation beneath the ice, it is difficult to understand how the ice shelves melt, how that melt controls the dynamic flow of grounded ice off the Antarctic continent and how the ice sheet influences the temperature, salinity and circulation of the polar oceans.
The limitations of this uncoupled approach for modelling ice sheet dynamics are widely recognised; it is also scientifically clear that if we are to model what is going to happen with ice sheets in the coming centuries, and if we want to reduce the uncertainty of low-likelihood high-impact sea-level rise projections, it is crucial to include ice sheet dynamics in Earth System Models.
Advancing the interactive modelling of ice sheet dynamics
After years of scientific and computational progress, some of the global ESMs that we use to make projections of 21st century climate are finally starting to include interactive ice-sheet models: UKESM already represents Greenland and Antarctica Ice Sheets and their interactions with the global ocean and atmosphere, and has done some future simulations; the PARASO regional model has the interactions between climate and the Antarctic ice-sheet dynamics represented; CESM and EC-EARTH have included interactions with Greenland ice-sheet dynamics, and for IPSL-CM and the US E3SM the implementation of the ocean and Antarctic ice-sheet coupling is ongoing (e.g. Comeau et al. 2022).
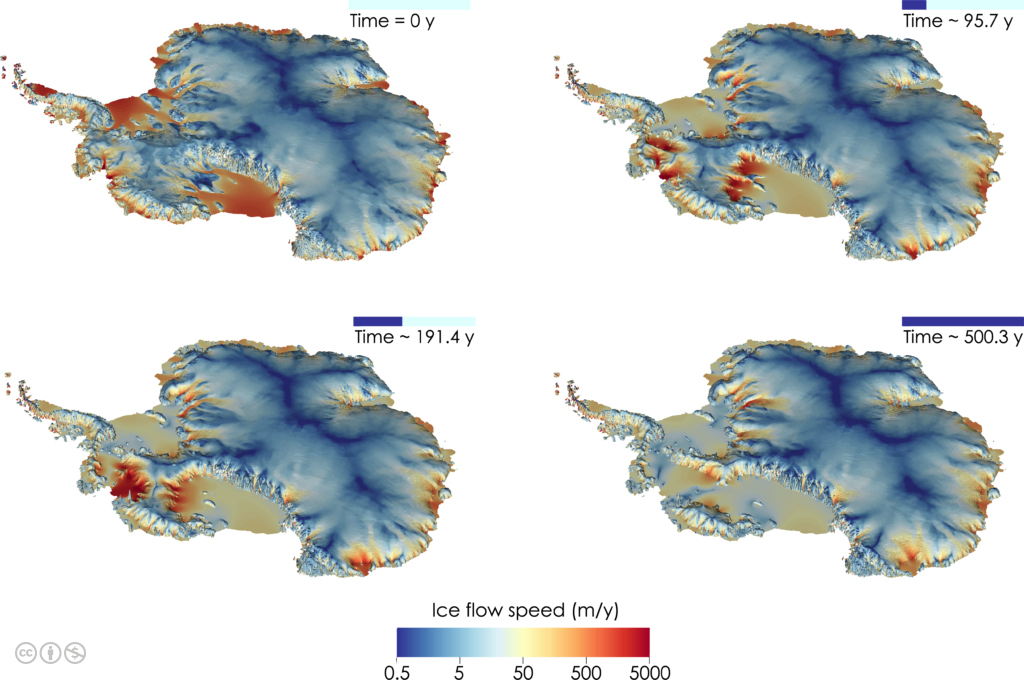
Simulation of the West Antarctic Ice Sheet collapse over a physically-plausible time scale: Time = simulation time (adapted from Steph Cornford’s simulation images).
In the scope of the ESM2025 project, joint work is being carried out by researchers working in UKESM and IPSL-CM models to support new developments in the implementation of interactive ISMs in these two Earth System Models. For UKESM, there is ongoing work to expand the current version of their ESM that already includes some of the processes by which Greenland and Antarctic ISMs can couple to the ocean and atmosphere; for IPSL-CM current work focuses on the coupling of a different Antarctic ISM with the ocean model NEMO. Both UKESM and IPSL-CM use NEMO, but even though the ocean model is the same, the ice-sheet and atmosphere models are quite different, which implies that many physical aspects and processes, such as the surface of ice-sheets, snow accumulation and glacier flow, are represented in different ways by these two ESMs. These differences will allow the researchers to explore ice sheet dynamics and climate feedbacks in complementary ways, and improve current understanding of the physics of these systems. Insights gleaned from this novel generation of Earth system models accounting for ice sheet dynamics and climate feedbacks will help to improve parameterizations of ocean-ice sheets interactions for a large array of climate models.
Challenges and open questions
At this stage, the science needed to properly achieve a comprehensive and realistic coupling of the ice sheet models in ESMs is still quite immature, and many technical challenges and open scientific questions remain.
The melting of ice sheets, ice shelves and icebergs occurs at very small spatial scales of a few kilometres or less, while atmosphere and ocean models used in CMIP (Coupled Model Intercomparison Project) simulations model most of the climate on grid cells that are 50-100 km in length; this implies a need for techniques and parameterisations to effectively increase resolution of some processes within ESMs to model realistic ice sheets interactively.
Another technical obstacle is associated with having the ice sheets expand or retreat in the ESMs. The positions of the boundaries between ice, ocean and atmosphere need to be able to move, bringing with it, for example, the need for the ocean model to transform previously-dry cells into wet cells when solid ice shelf melts and becomes ocean.
Even though some ESMs are now capable of modelling parts of the physics of ice sheets and their interactions with the climate system, they are only capable of doing it for relatively gradual processes; abrupt events, such as massive ice sheet collapse in a short period of time cannot yet be modelled. Even from a theoretical glaciology point of view there is still a lot of uncertainty about how such things might occur. Hence, there is yet some way to go until we are capable of modelling abrupt events, but we should be able to provide some first estimates in the scope of ESM2025.
The initialisation conundrum
All Earth System Models partaking to CMIP produce a pre-industrial control simulation (piControl) with non-evolving pre-industrial conditions representative of the period prior to the massive industrialization, chosen to be 1850, after the Little Ice Age. The piControl simulation, of at least 500 years long, starts after an initial climate multi-centennial to multi-millennial spin-up, during which the climate is expected to come into balance with the forcing. Then, climate projections are built by perturbing the simulation with emissions of greenhouse gases and aerosols, and the difference with piControl gives the impact of those human emissions on climate.
This approach is problematic for representing the evolution of ice sheets, because they have a much longer memory of the initial conditions than the rest of the climate system. Hence, as we start climate projections, a part of their behaviour may still be attributed to climate signals of a few millennia old. An ice sheet in balance with a piControl climate would therefore be (i) long to obtain, and (ii) fundamentally different from the real ice sheets in 1850. If the ice sheet does not have a realistic temperature, front, or grounding line position in 1850, it will not evolve in a realistic way, whatever the forcing is.
Although it is important to have the initial ice sheet state as realistic as possible, we do not have much evidence of what preindustrial ice sheets were. Early explorers, like James Ross (1841), described Antarctic ice shelf fronts at a few locations, naming them “ice barriers”, but a comprehensive description of the Antarctic ice-sheet thickness only became available in the mid 1990s, thanks to satellite remote sensing. Therefore, our current best option is to find physically plausible ice-sheet states for 1850, which, when we evolve them forward under 20th century climate forcing, come to match the ice sheet observations when the simulations reach the mid 1990s to 2022.
CONCLUSION
Even with the recent progress in climate and ice sheet modelling, there are still many significant research challenges ahead before we can usefully reduce the uncertainty of sea-level rise projections, especially when considering the multi-centennial timescales of changes we have already triggered, or low-likelihood high-impact scenarios. However, if we hope to be capable of simulating such processes in the near future, we need to start improving our understanding and capabilities in this area urgently. To do so, we need to get scientific communities that are used to working apart to work together: ocean, ice sheet and atmosphere modellers and researchers will have to carry out strongly transdisciplinary work in order to develop a new generation of Earth System Models that includes interactive ice-sheet dynamics.
In the meanwhile, no one modelling approach is obviously the best, or even adequate yet. We still need a hierarchy of different models, stand-alone ice-sheet model projections, and more observations to learn from and to challenge those models. At the moment, ESMs with interactive ice-sheets are still one tool among others, not necessarily the best possible tool to produce projections of sea-level rise or ice-sheet collapse, but one that is essential for understanding and evaluating the impacts of ice sheet dynamics on the climate system.
![]()

Authors: Mariana Rocha, Nicolas Jourdain, Robin Smith.
ESM2025 researchers working on this topic: Steve George (University of Reading, UK), Fabien Gillet-Chaulet, Gaël Durand, Olivier Gagliardini, Mondher Chekki, Cruz Garcia-Molina and Pierre Mathiot (Institute of Environmental Geosciences, France).